Is it possible to have dtill down in Charts /Trend

I have trend where I am showing some stats based on the month , I have also information available based on the WKs. But in the Trend chart 1st I want to show the By month Stats .
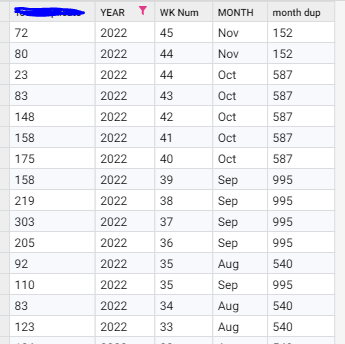
Now in Trend 1st I want to show the trend by month , and then there will be options to drill down more to weeks , Is it possible to do that now with Aperture
Best Answer
-
You could group the weeks by month in the chart something like:
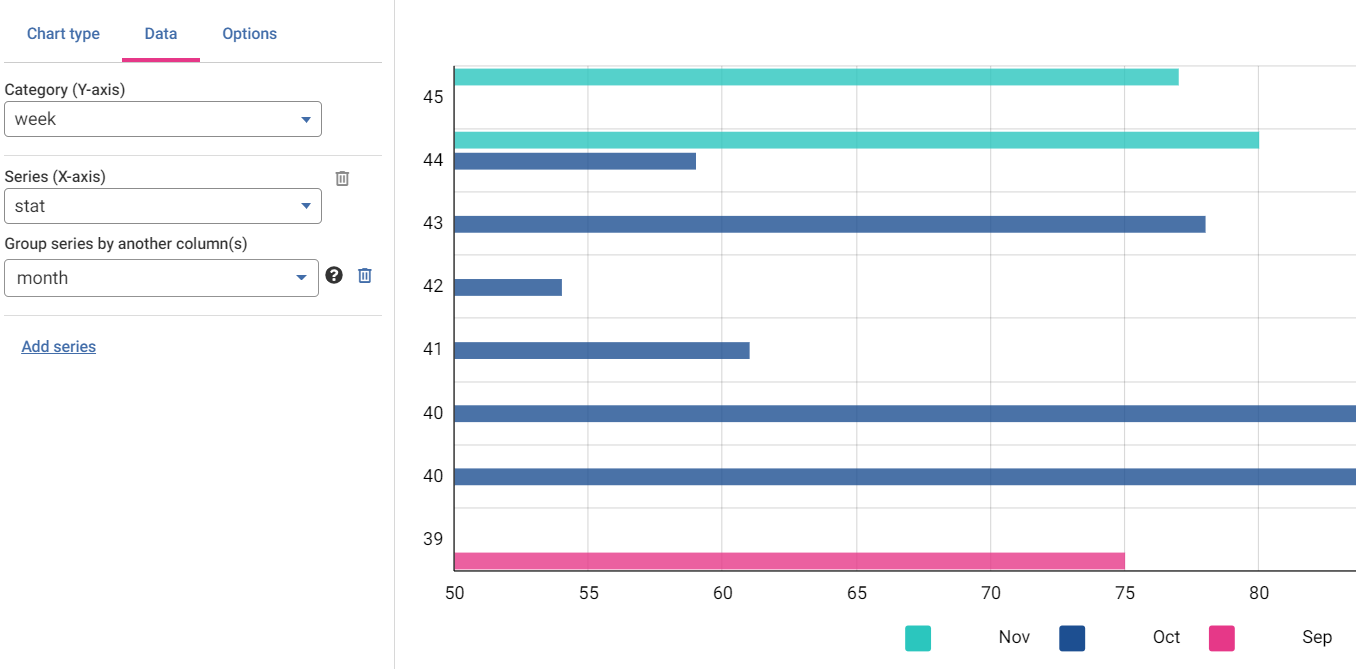
But im not sure that is exactly what you are after
0

Answers
-
Hi Muhulima
Ignoring Data Studio, do you have any thoughts on what the chart might look like? With that someone might be able to suggest ways of producing it in Data Studio
0 -
@Josh Boxer I am expecting something like this , this is in Data Studio but when I hover on the graph I can only see day as in X axis I selected Day
In the screen shot if you see closely there are 3 colors of wave one for day, one for wk and one for month, I day when I hover on Day I can Select Day count and Day Number, when I hover on week graph I can see week count and week number, currently I can see week count but number is showing day number instead of week number. Idea is there will be 3 buttons like that in the below screen shot and If all selected all stats will show if only day selected then it will show day wise if day & week selected it will show day and week wise both
 0
0