Aperture API to get the health of the system CPU Usage
Can we get the health of the environment through API?
What is TenancyID? how can we get the CPU usuage and other details of the enviornment.
If we get the response in JSON from API we can Consume the JSON in Aperture and Publish it in a Report or Table but how we can automate those? from consuming JSON to Publish in the report
Comments
-
Hello
The TenancyID is the External label of the Environment shown on the Manage Environments page. If you only have one environment then it is likely not to have been changed and so be 'default'.
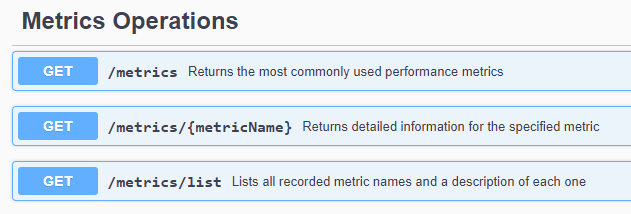
There are APIs to query metrics such as disk space and cycle time: https://docs.experianaperture.io/data-quality/aperture-data-studio-v2/extend-data-studio-functionality/use-the-rest-api/#generate-system-monitoring-metrics
JSON files can be imported in Data Studio https://docs.experianaperture.io/data-quality/aperture-data-studio-v2/get-started/get-data-use-datasets/#upload-file-or-load-from-directory Datasets will always be in table form and can be included in a report or Dashboard.
Since the API call is happening outside of Data Studio, automating it would take a little work, but you could use some kind of script that queries the API and deposits the response in a dropzone or if you wanted a Workflow to call the API then you could build a custom step https://docs.experianaperture.io/data-quality/aperture-data-studio-v2/extend-data-studio-functionality/use-the-sdk/
2 -
When system metrics collection is enabled, the metrics are also logged to the monitor.log file in the log folder (https://docs.experianaperture.io/data-quality/aperture-data-studio-v2/set-up/install-data-studio-on-windows/#database-folder-locations)
Typically the Metrics API would be consumed by a separate application performance monitoring tool, like Azure Application Insights2


