Grouping in V2 and differences with V1

if you're working with financial data with Aperture Data Studio, one of the things that you might want to do, is to rollup columnar values and produce aggregates. When you produce aggregates you don't necessarily want to see all the columns or all the rows. Certainly if you see all the columns, the challenge can be actually getting the data to properly show you the values that you care about.
In my excel file i have transactions that relate to payments over time
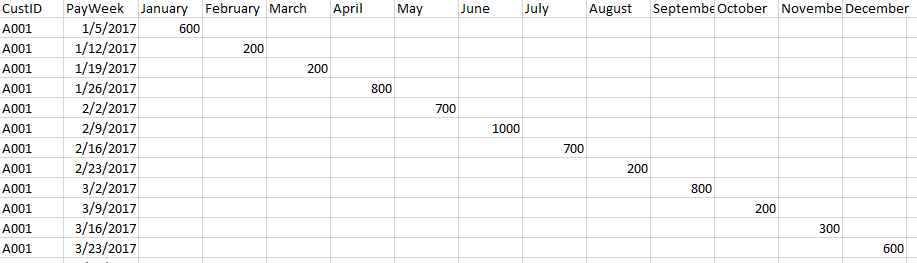
My mission is to aggregate the contents of the columns into one column and show the last payment date, grouped by CustID.
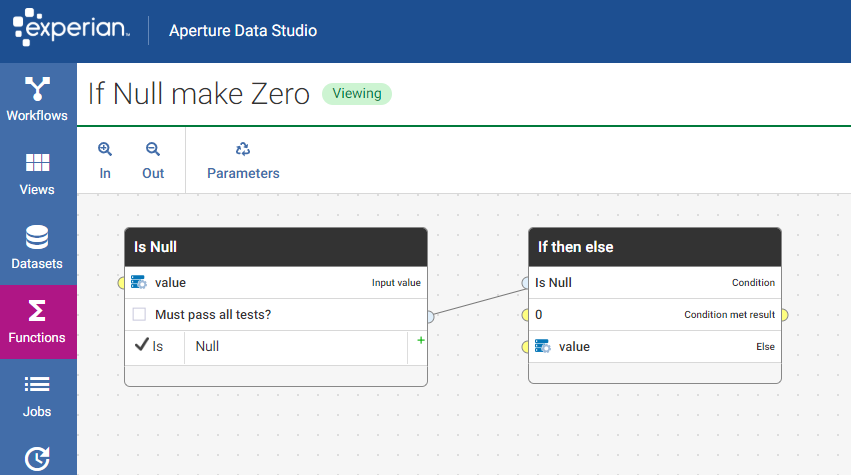
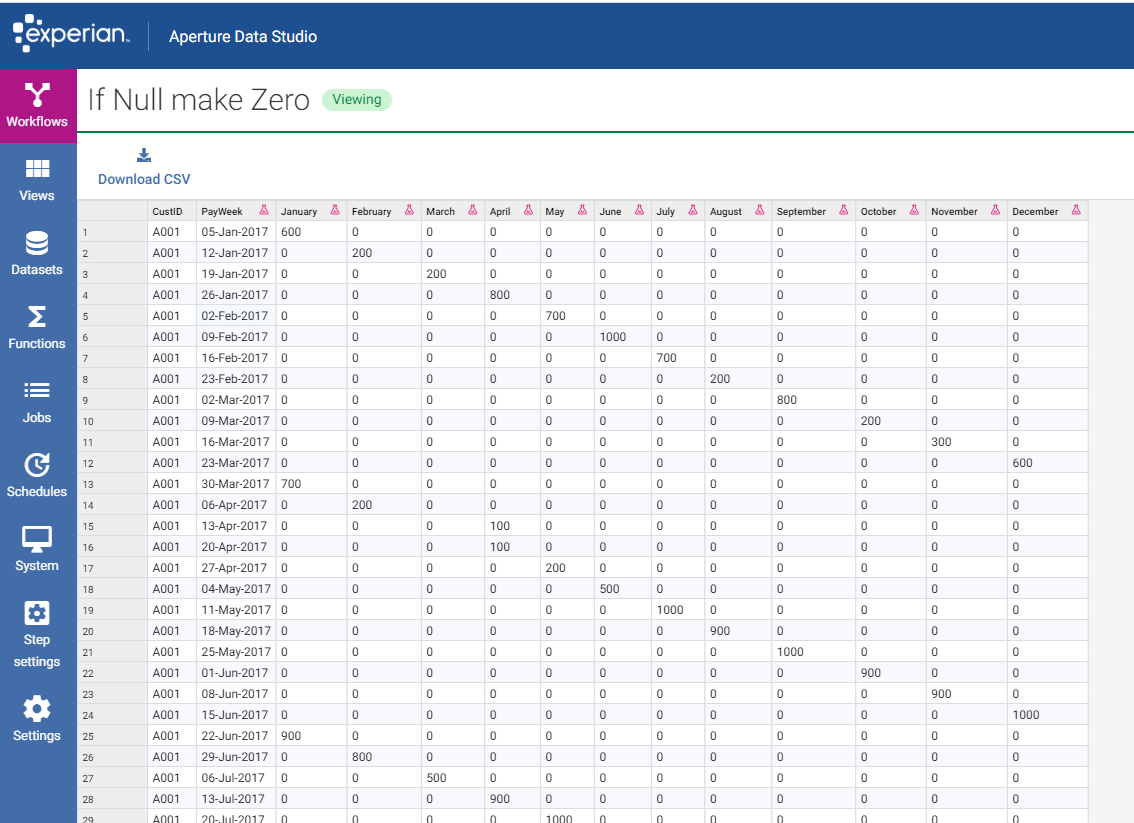
I'll have to do a couple of things to achieve this in v1, namely replace null values with zeros to get the calculations to work using a transform and then add the column values and then do the grouping.
In v1 you also have the ability to hide and reveal columns even if they're not actually part of the grouping step. In this example my workflow also includes a sort step that allows me to sequence the data.


In v2 my workflow is ostensibly the same but much faster to assemble, the date handling when working with Excel was a little different, in that I had to suppress the time section of the date column even though the datatype was set as date.

The ability to create a reusable function for the nulls and reset as zeros was a time saver and then being able to apply that across many columns saved additional time.
In the grouping step the choices one makes, are simplified however the additional aggregation options available are ostensibly the same as for V1

but instead of using column hides, consider using the last or first value option
in v2 there are two additional choices to consider also

So, in the end my configuration has latest date calculated by using an aggregation

If you have found anything yourself with grouping of interest or a particularly interesting use case, then let us know.